Industry Insights
THE GENERATION MIX
Renewables exceeded 50% of the UK’s electricity supply
The UK's energy landscape is undergoing a significant transformation as it strives to meet its ambitious clean energy targets.
The government aims for clean power to meet 100% of electricity demand by 2030 and no more than 5% from gas. This vision aligns with the National Energy System Operator's (NESO) clean power pathways, which estimate that wind and solar will contribute between 77% and 82% of the UK's electricity generation by 2030.
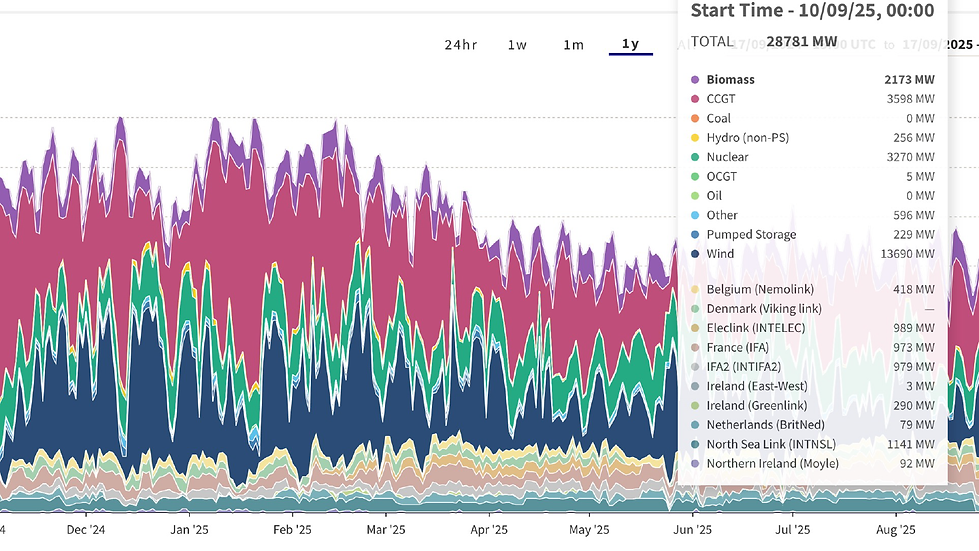
This graph data to the right comes directly NESO’s real-time monitoring, showing how different fuel types contribute to the UK grid.
It captures imports, pumped storage, and renewables, giving a live picture of how the system balances supply and demand.
What’s interesting is how quickly the mix shifts, on windy days renewables can power over half the country, but when the wind drops, gas generation ramps up. This volatility is exactly the challenge and the opportunity, that smart grid controls like Grid Enigma are designed to address.
WIND FORECAST
Wind forecasts reveal when local renewable generation will surge or dip, unlocking smarter energy trading.

NESO forecast modelling is based on both historical outturn as well as local wind forecasts. NESO will publish updates to the forecasts values up to 8 times a day which help to predict electricity prices.
When wind generation is high, the system can experience excess supply, pushing prices down, while low wind output increases reliance on more expensive backup generation, driving prices up.
For peer-to-peer trading, these forecasts are essential for planning generation, consumption, and storage decisions. Local generators can use periods of high predicted wind to supply neighbours directly, avoiding low-value exports to the grid, while local consumers and batteries can schedule usage when wind output is low to avoid high prices.
MARKET INDEX PRICES
Renewables exceeded 50% of the UK’s electricity supply

Elexon is the company that runs the Balancing and Settlement Code (BSC) in the UK, essentially handling the settlement of electricity trading on the wholesale market.
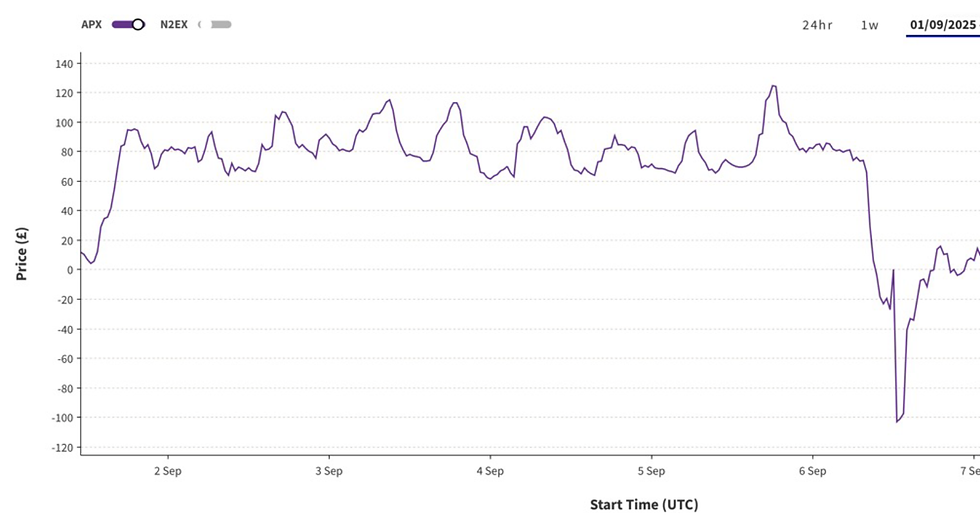
Market Index Prices (MIP) are half-hourly electricity prices published by Elexon that reflect the actual cost of balancing the system.
They are calculated after the fact (“ex-post”), not in advance.
They are based on the actions National Grid ESO had to take to balance supply and demand in each half-hour period.
If supply is tight and more expensive balancing actions are taken, the MIP goes up. If there’s excess generation, it can go down (sometimes even negative).
Arbitrage opportunities
If MIP spikes high during peak demand, those with generation (solar, batteries) can sell power at high prices directly to others or feed it into the grid.
NETWORK & LOCATION DATA
T&D charges account for 20 - 25% of total energy bill costs

Transmission (TNUoS) and distribution (DUoS) charges make up a significant portion of a commercial electricity bill, often accounting for 15–25% of total costs depending on location and consumption profile.
These charges reflect the cost of transporting electricity over the high-voltage grid and local distribution networks.
By trading electricity locally through peer-to-peer arrangements, participants can reduce stress on both transmission and distribution networks, shortening the path electricity must travel, lowering losses, and avoiding network congestion.
These avoided costs highlight the value of local energy sharing and provide a strong case for revising settlement rules to recognize and reward the efficiency and flexibility created by local trades.

Typical Load & Generation Profiles

LOAD PROFILE STUDY
Linking Generation to Demand
A load profile study was carried out by our subcontractor Zeco Energy to understand how local solar generation could align with energy demand across different customer types. The study analysed data from a mix of commercial and industrial users, supported by domestic smart meter data to model residential consumption patterns within the same regions.
To inform the modelling, three example rooftop PV schemes were assessed:

Newcastle
50 kW rooftop system
Estimated annual generation: 48,180 kWh
Bristol
100 kW rooftop system
Estimated annual generation: 105,120 kWh
Nottingham
150 kW rooftop system
Estimated annual generation: 151,110 kWh
Modelling
MODELLING
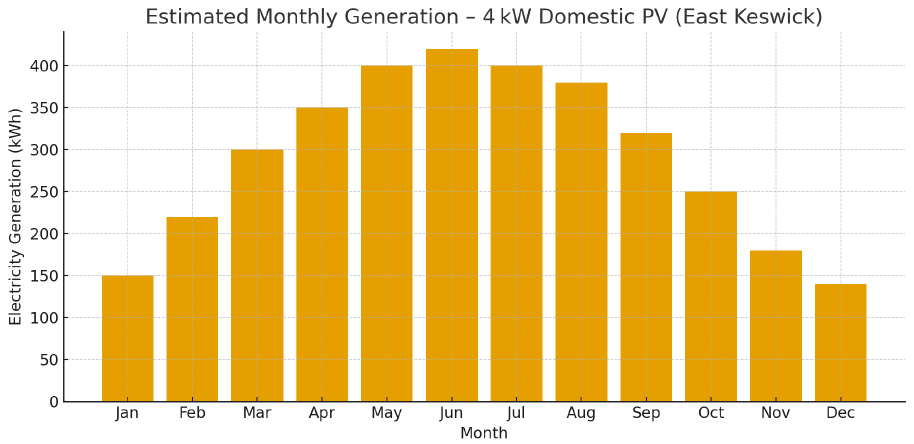
This modelling exercise explores how locally generated solar energy could support peer-to-peer (P2P) trading between commercial and domestic users within East Keswick, West Yorkshire. The analysis is based on typical UK solar performance data, adjusted for the region’s latitude and average weather conditions. Both a 50 kW commercial rooftop system and a 4 kW domestic rooftop system were modelled to demonstrate the relative scale and seasonal variation in generation.
For the 50 kW commercial rooftop PV system, the estimated annual generation is approximately 45,000 kWh, with output peaking in the summer months of May through August when longer daylight hours and higher sun angles maximise production. Monthly generation ranges from around 2,000 kWh in winter to 5,000 kWh in June, assuming a south-facing roof with minimal shading and standard system efficiency.
In contrast, a typical 4 kW domestic system in the same area produces around 3,500 kWh per year. While the seasonal profile follows the same pattern, the overall scale is much smaller, with generation varying from roughly 140 kWh in December to 420 kWh in June.
By comparing the two datasets, it becomes clear that a single 50 kW commercial installation could generate enough surplus electricity to support approximately 12–14 local homes, based on average domestic demand. This forms a strong foundation for localised peer-to-peer energy trading, where excess energy from commercial sites could be shared directly with nearby households. Such arrangements could reduce grid imports, enhance local energy resilience, and help mitigate fuel poverty within the community.